Co-managed data techologies and practicalities (part 1)
I’ve had lots of good feedback and iteration on my first post on co-managed data; thanks for that. I’ll mix that into this post, and also start to drill down into some more detail of what I have in mind when I refer to co-managed data, and also touch on how that might emerge.
The main questions that came back were around the nature of the tools an individual might use to manage ‘my data’ and ‘our data’, both precursors to genuinely co-managing data. I’ve attempted to set out the current options and models in the graphic below. (I suspect i’ll need to write up a separate post explaining the distinctions).
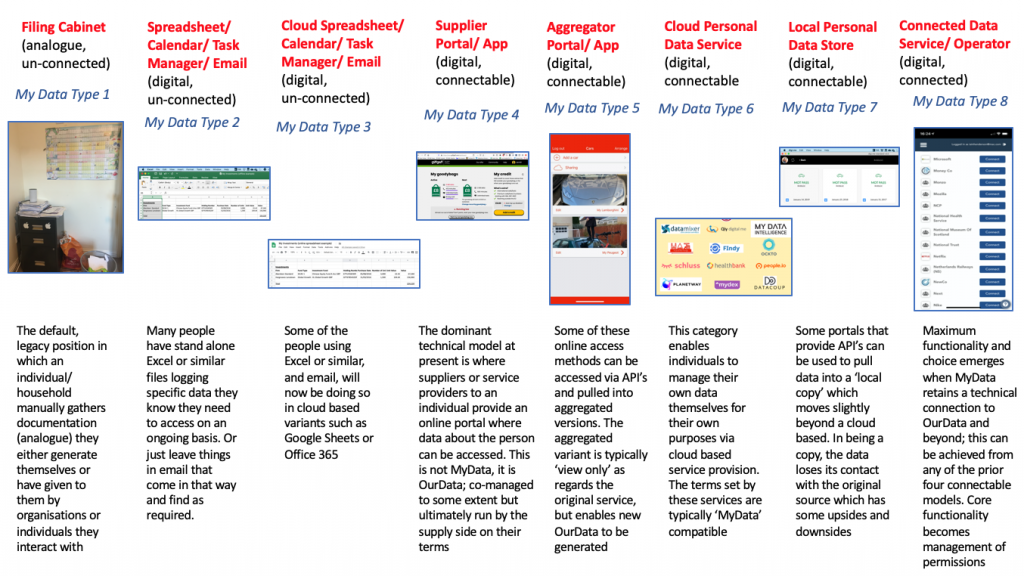
The current reality is that the vast majority of individuals can only, and will therefore, be running a hybrid of these approaches. That’s because the variants towards the left hand side cannot cope with the requirements of some modern service providers/ connected things. And the variants towards the right cannot cope with the requirements of some relationships and ‘things’ that remain analogue/ physical.
If one was to look at the proportion of ‘My Data’ that is being managed across these options then we need some basic assumptions of volumes. So for the sake of time and calculation, let me assume that every adult individual in the modern world has:
– 100 significant supply relationships – 200 ‘things’ to be managed, – 20 data attributes (fields, not individual data points) from each relationship and 10 from each ‘thing’ – so a total of 4,000 data assets under management. The actual real number is much higher and largely out of the individuals control at present. Come to think of it, that explains why research regularly comes back with the comment that individuals feel they have ‘lost control of their personal information’ – they are right, for now…
In my case, simplistically, I’d estimate that I have my data split across the types as follows (stripping out duplicates, i.e. not my master record, and back-ups of which there are inherently many in the hybrid model). Type 1 – 15% (inc some critical data), Type 2 – 30%, Type 3 – 5%, Type 4 – 35%, Type 5 – 5% , Type 6 – 9%, Type 7 – 0.9%, Type 8 – 0.1%
My numbers will be dis-proportionally high I guess towards Type 6 as I use more of these than most; and very few will have anything at all in Type 8 at present as it is brand new.
In any case, this post is already pretty dense, so i’ll leave it there for now and pick up the next level of detail in the next post.